Amazon River, Rainforest, West Brazil Meta Data and Truecolour Image
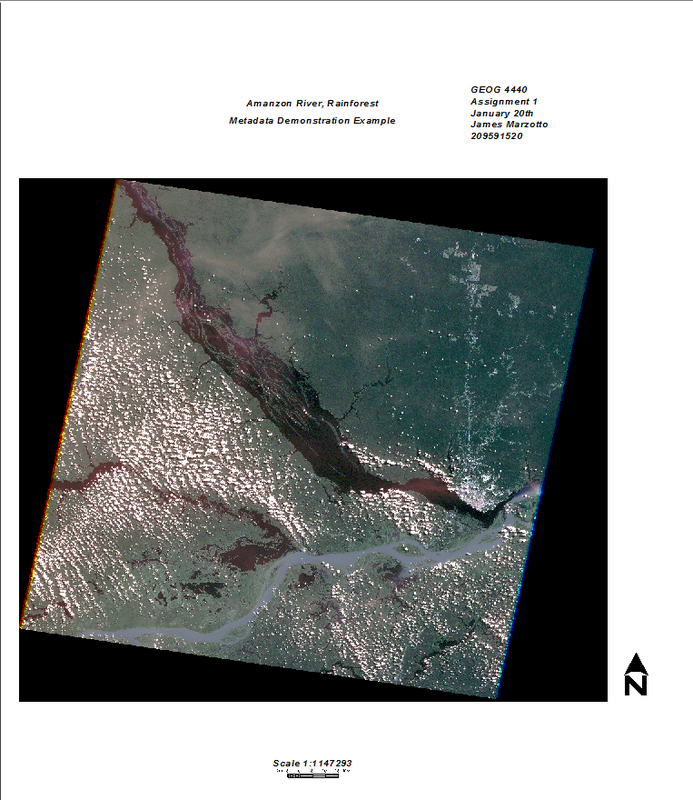
Below is a remote sensing image of a section of the Amazon River, located in the rain forest West Brazil and its surrounding area. Below the image is the images' own metadata. Analyzing the data will provide the user with an understanding of the maps origins and other information about the visual information that the user may
find of use. This image is much different from the previous picture of Rhode Island and the surrounding areas. Instead of presenting data of a remote sensing image that shows a highly urbanized area, I chose to present an image of a geographically remote area with abundant vegetation and limited human development. Still, in this image, in the northwest quadrant, you can evidently see areas of forest destruction. Remote sensing is heavily used in forest management as it makes it easier to track the growth and removal of trees in regions are hard to get to. The dark green section in the middle of the screen would be interesting to study. It is an indication of dense vegetation growth.
The false colour image has high purple reflectance that heightens the fact this is indeed an area of dense vegetation. In the gray scale image, we are able to get a sense of the NDVI. It ranges typically between 0.5 and 0.8 reflectance. The amazon rain forest is abundant in tropical vegetation due to its warm wet climate so this was expected.
The thermal image was made by turning the 5th band do show in pseudo colour. Here we are able to track the cloud movements. The temperature remains fairly constant throughout the image. Meaning there is nothing od inter
The metadata below will be able to provide more detailed information on the
picture.
Click here for a link to its band's
histograms:

Interested in what else can be done with the above image using remote sensing software? Click the two images below to see it as either a "unsupervised classification" or it can be also seen in a "false colour" image. There's even a picture that is thermal check them out!


Metadata
Citation:
Citation_Information:
Originator: U.S. Geological Survey (USGS)
Publication_Date: 20101210
Title: LANDSAT TM - Path: 231 Row: 62 for Scene: LT52310621984153CUB04
Geospatial_Data_Presentation_Form: remote-sensing image
Publication_Information:
Publication_Place: Sioux Falls, SD USA
Publisher: U.S. Geological Survey Earth Resources Observation and Science
Entity ID:
LT52310621984153CUB04
Acquisition Date: 01-JUN-84
# Path: 231
# Row: 62
Data Set Attribute
Attribute Value
Landsat Scene Identifier: LT52310621984153CUB04
Spacecraft Identifier: LANDSAT_5
Sensor Mode: SAM
Station Identifier: CUB
Day Night: DAY
WRS Path: 231
WRS Row: 062
WRS Type: 2
Data Category: NOMINAL
Date Acquired: 1984/06/01
Start Time:1984:153:13:40:46.21500
Stop Time: 1984:153:13:41:12.82806
Data Type Level 1 :TM L1T
Sensor
Anomalies
N
Acquisition Quality
9
Quality Band 1: 9
Quality Band 2: 9
Quality Band 3: 9
Quality Band 4: 9
Quality Band 5: 9
Quality Band 6: 9
Quality Band 7:9
Cloud Cover: 5.74
Cloud Cover Quadrant Upper Left:4.94
Cloud Cover Quadrant Upper Rig:17
Cloud Cover Quadrant Lower Lef: 11.27
Cloud Cover Quadrant Lower Rig 6.58
Sun Elevation: 47.7932488
Sun Azimuth
51.88819392
Scene Center Latitude -2.89492
(2°53'41.71"S)
Scene Center Longitude
-60.59569 (60°35'44.48"W)
Corner Upper Left
Latitude
-1.97915 (1°58'44.94"S)
Corner Upper Left Longitude:-61.24914 (61°14'56.90"W)
Corner Upper Right
Latitude
-2.21851 (2°13'06.64"S)
Corner Upper Right
Longitude -59.60325
(59°36'11.70"W)
Corner Lower Left
Latitude
-3.57055 (3°34'13.98"S)
Corner Lower Left
Longitude
-61.58924 (61°35'21.26"W)
Corner Lower Right
Latitude
-3.81023 (3°48'36.83"S)
Corner Lower Right
Longitude -59.94111
(59°56'28.00"W)
Browse Exists
Yes
Attribute_Accuracy_Report:
The identification of features is provided by the distinct electromagnetic energy it emits, reflects, or otherwise transmits. This is called the spectral signature. Other signatures such as tone (lightness or darkness), texture (surface roughness or smoothness), pattern, shadow, shape, and size are as important. Thus, through the use of the thematic mapper sensor, such elements as ater features, soils, and vegetation can be identified and distinguished from each other.
Logical_Consistency_Report:
N/A
Completeness_Report: The Landsat platforms operate from a sun-synchronous, near-polar orbit imaging the same 185 km (115 miles) ground swath every 16 days.
The landsat system provides for global data between 81 degrees north latitude and 81 degrees south latitude.
Citation:
